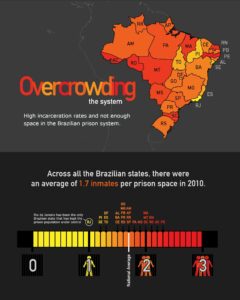
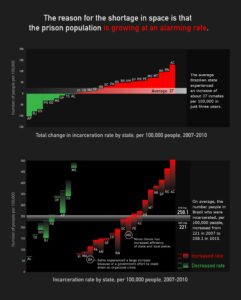
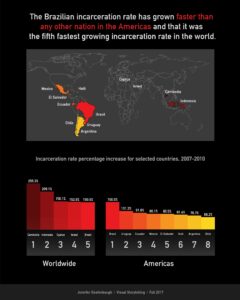


This was a piece highlights the issues with incarceration in Brazil, showing through data visualization the problems with overcrowding that prisoners experience.

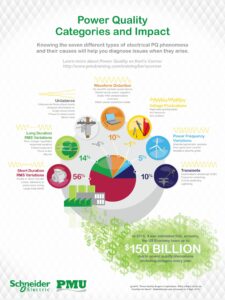
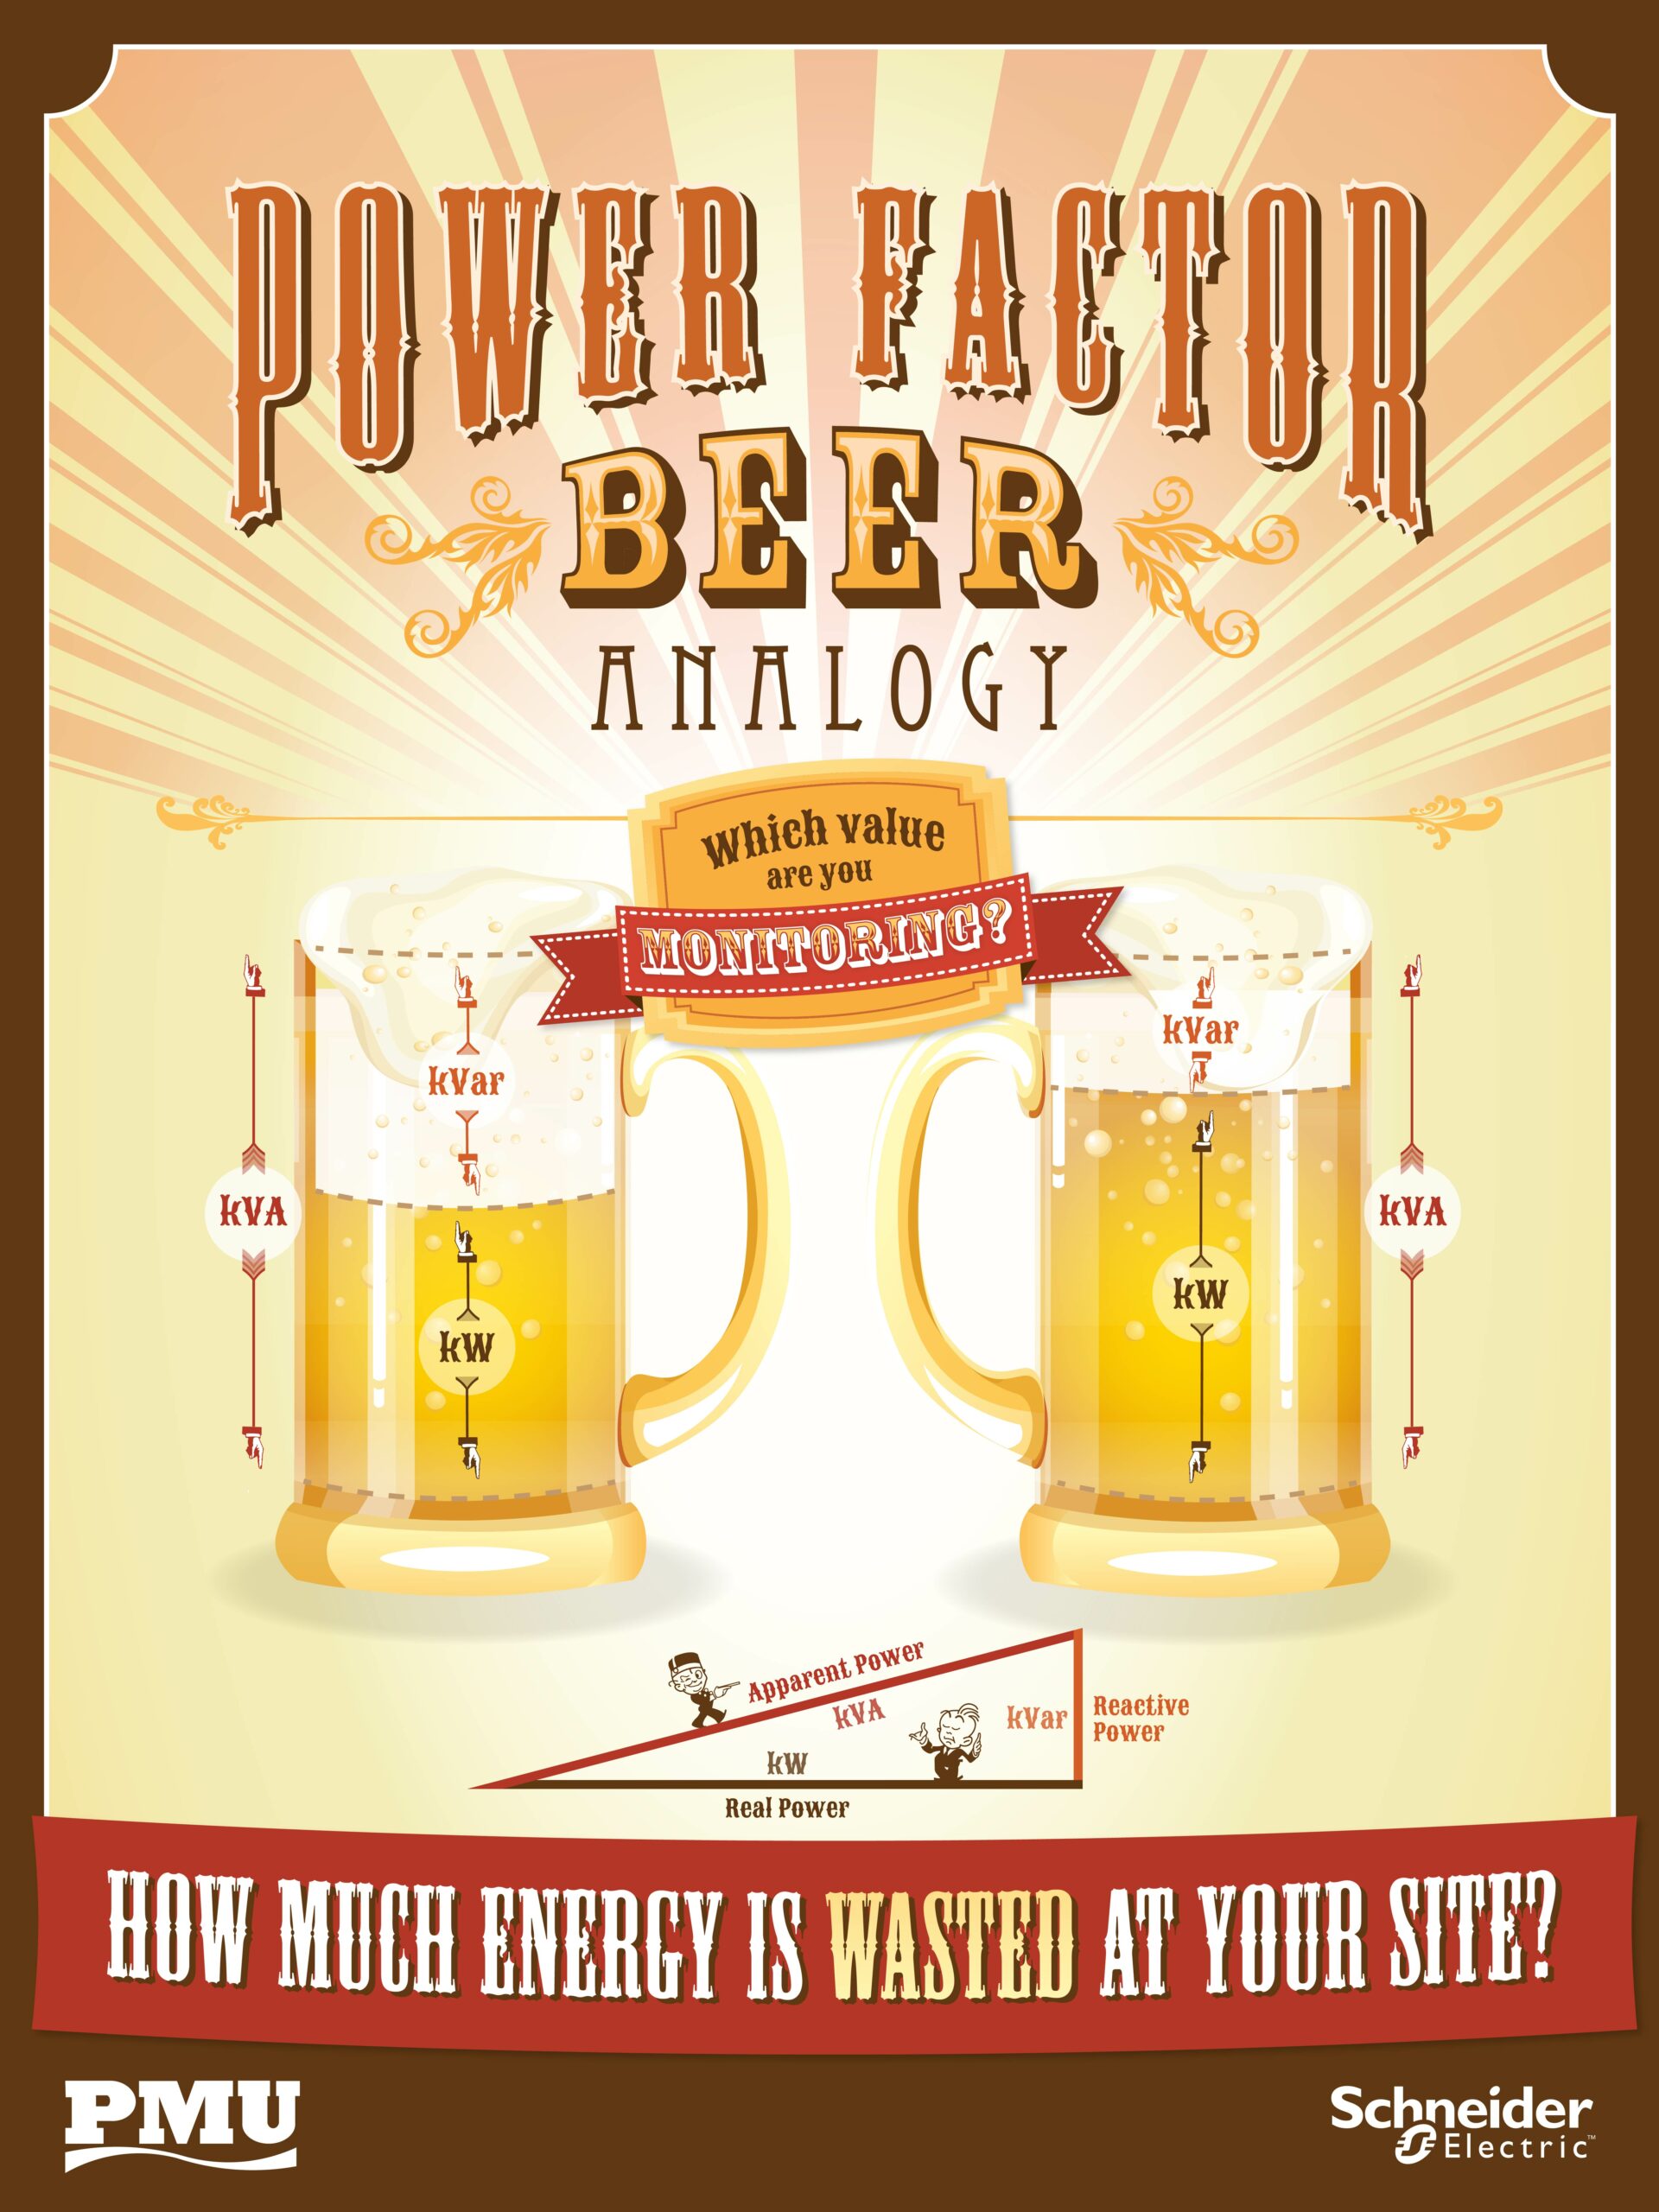

This poster series was designed to supplement the power monitoring training at Power Monitoring University (PMU) within the Nashville Hub at Schneider Electric. Custom vector illustrations were combined with simplified graphics of the concepts for adult learners. These learners manage power operations for university, government, military, hospitals, and other critical facilities.
UX Design x AI
Smarter User Experiences
My work helps to make the way businesses and everyday people consume energy more efficient. Good design is about creating meaningful connections between technology and people and helping solve real-world problems. I work for a team called the AI Hub within Schneider Electric, where our mission is to scale AI across a portfolio of ~150 software products and a much larger number of IoT devices.
My approach to design revolves around spending time with end users and really taking the time to understand their needs. Often I’m working on projects for industry and energy management, and the people who work in those fields have incredibly deep, specific knowledge. It would be impossible to create effective tools for them without getting to know them and their pain points well.
The teams I work with use this knowledge to create software solutions that leverage artificial intelligence to solve problems that are quite complex. including anomaly detection, energy optimization, computer vision, fault detection, and other machine learning/AI techniques.
Please contact me for work examples. I am very limited in what I can share.
ittybittyartist@gmail.com
Alignment Through Visualization
Working with large software teams requires aligning the vision of project managers, engineers, developers, end users, and other business stakeholders. My role often involves capturing feedback from a wide range of different types of people and making sure that all needs are accounted for.
Previsualization, storyboarding, and fast prototypes are absolutely essential. It helps the entire team get on the same page, and often leads to new ideas from the development team about features that end up being incredibly valuable.
I have experience producing a range of documents including hand drawn storyboards, interactive mockups, pitch decks, explainer and demo videos, and refined designs.
DESIGN + ANALYTICS
Understanding how to work with data and how to build metric tracking mechanisms into the interactive tools ensures that we can capture and respond to patterns in user behavior. This is a key part of the design process that often gets overlooked, but it’s critical to help understand how features are performing.
My experience also includes a Master’s in Information Visualization, with experience cleaning and working with data and building dashboards and visualizations in a variety of tools.
(Python/Streamlit, Tableau, R Shiny, D3.js etc.)
Discovery + Journey Mapping
Wireframe + Interface Design
Prototyping + Dashboarding
User Testing + Analytics